Prepared By
Principal, Multifamily Investments
CA DRE #01999901
(818) 555-0140
dana.whitfield@westonridge.example
Director, Investment Sales
CA DRE #01999902
(818) 555-0141
andre.cortez@westonridge.example
15250 Ventura Boulevard, Suite 400
Sherman Oaks, CA 91403
This is a sample document
Ridgeway Gardens Apartments does not exist. The address, ownership, brokerage, agents, licence numbers, rents, expenses, comparables, and every financial figure shown were invented to demonstrate document structure. Nothing here describes a real property, a real opinion of value, or a real engagement.
Purpose. This Broker Opinion of Value has been prepared at the request of ownership to assist in evaluating a potential disposition. It sets out an opinion of the price the subject would most probably achieve in an arm's-length sale, exposed to the open market for a reasonable period.
This is not an appraisal. It has not been prepared in conformance with the Uniform Standards of Professional Appraisal Practice, and the preparers are licensed real estate brokers rather than certified appraisers. It may not be relied upon for lending, litigation, taxation, estate, or regulatory purposes. Where a certified valuation is required, ownership should engage a licensed appraiser.
Information relied upon. The opinion rests on a rent roll and trailing operating statements supplied by ownership, public assessor records, and comparable transaction data obtained from third-party sources. None of this material has been independently audited or verified. Should the rent roll, in-place rents, or operating expenses differ materially from what was supplied, the conclusion will change.
Rent regulation. The subject sits within a jurisdiction subject to local rent-stabilisation regulation. Allowable increases, relocation obligations, and just-cause eviction requirements materially constrain the pace at which the rent upside identified here can be realised. Ownership should confirm the regulatory status of each unit with counsel.
Market conditions. The conclusion reflects conditions as of the date of preparation. Interest rates, credit availability, and buyer appetite in this asset class move quickly; an opinion more than ninety days old should be refreshed before it is acted upon.
No obligation. Delivery of this document does not create an agency relationship or a listing agreement, and imposes no obligation on either party.
Apartments
Reseda, CA 91335
A 24-unit garden apartment community held since 1998, carrying 11.2% of embedded rent upside and priced into a comparable band that has traded five times in the trailing twelve months.
Andre Cortez
We recommend bringing Ridgeway Gardens to market at $7,450,000 — a 5.21% going-in capitalisation rate and $310,417 per unit — and expect a closed sale between $7,250,000 and $7,650,000.
How the range was derived
The concluded range applies the observed comparable capitalisation band to the subject's current net operating income of $388,314. The five comparable sales transacted between a 5.02% and 5.34% cap, averaging 5.16%. We widened this to a 5.00%–5.50% band to reflect the spread of buyer cost of capital currently in the market.
- Current net operating income
- $388,314
- Value at 5.00% cap
- $7,766,000
- Value at 5.25% cap
- $7,396,000
- Value at 5.50% cap
- $7,060,000
- Comparable average cap
- 5.16%
- Comparable average per unit
- $309,000
Where we would start
We recommend listing at $7,450,000 rather than at the midpoint of the range. It prices just above the comparable per-unit average — justified by the subject's 1986 vintage and two-bathroom plans — while remaining inside the cap band every recent buyer has underwritten to. That combination generates competitive tension at the call for offers rather than a single negotiated bid.
What would move this conclusion
A verified trailing-twelve operating statement materially different from the figures supplied; confirmation that any in-place rent is not legally established; deferred maintenance discovered on inspection; or a move of more than 50 basis points in agency financing costs before launch. Each of these would warrant refreshing the opinion before going to market.
Each row holds the current net operating income of $388,314 constant and solves for the return metrics a buyer sees at that price. The shaded row is our recommendation; the comparable average cap of 5.16% falls between the $7,450,000 and $7,650,000 rows.
| List Price | Cap Rate | $ / Unit | $ / SF | GRM | Pro Forma Cap | Position vs. Comp Set |
|---|---|---|---|---|---|---|
| $7,050,000 | 5.51% | $293,750 | $344.57 | 11.89 | 6.57% | Below every comparable — leaves value on the table |
| $7,250,000 | 5.36% | $302,083 | $354.35 | 12.23 | 6.39% | Inside the band, priced to move quickly |
| $7,450,000 | 5.21% | $310,417 | $364.13 | 12.57 | 6.22% | Recommended — just above comp average per unit |
| $7,650,000 | 5.08% | $318,750 | $373.90 | 12.90 | 6.05% | Achievable with a 1031 or long-hold buyer |
| $7,850,000 | 4.95% | $327,083 | $383.68 | 13.24 | 5.90% | Through the band — expect extended days on market |
| Comparable Avg | 5.16% | $309,000 | $356 | 12.63 | — | Five sales, trailing twelve months |
Reading the matrix
Buyers in this size band underwrite primarily to going-in cap rate and secondarily to price per unit. The two metrics disagree slightly here: at $7,450,000 the subject is 0.5% above the comparable average per unit but 5 basis points wide of the average cap — meaning it looks marginally expensive on a unit basis and marginally cheap on yield. That is a favourable place to be, because the yield argument is the one a lender and an investment committee test.
Notes
Pro forma cap rates apply the pro forma net operating income of $463,053 to each list price, and assume the full rent gap is captured. Rent stabilisation will stage that capture over several years; the pro forma column is therefore a stabilised outcome, not a year-one result. Every figure on this page is invented for this sample.
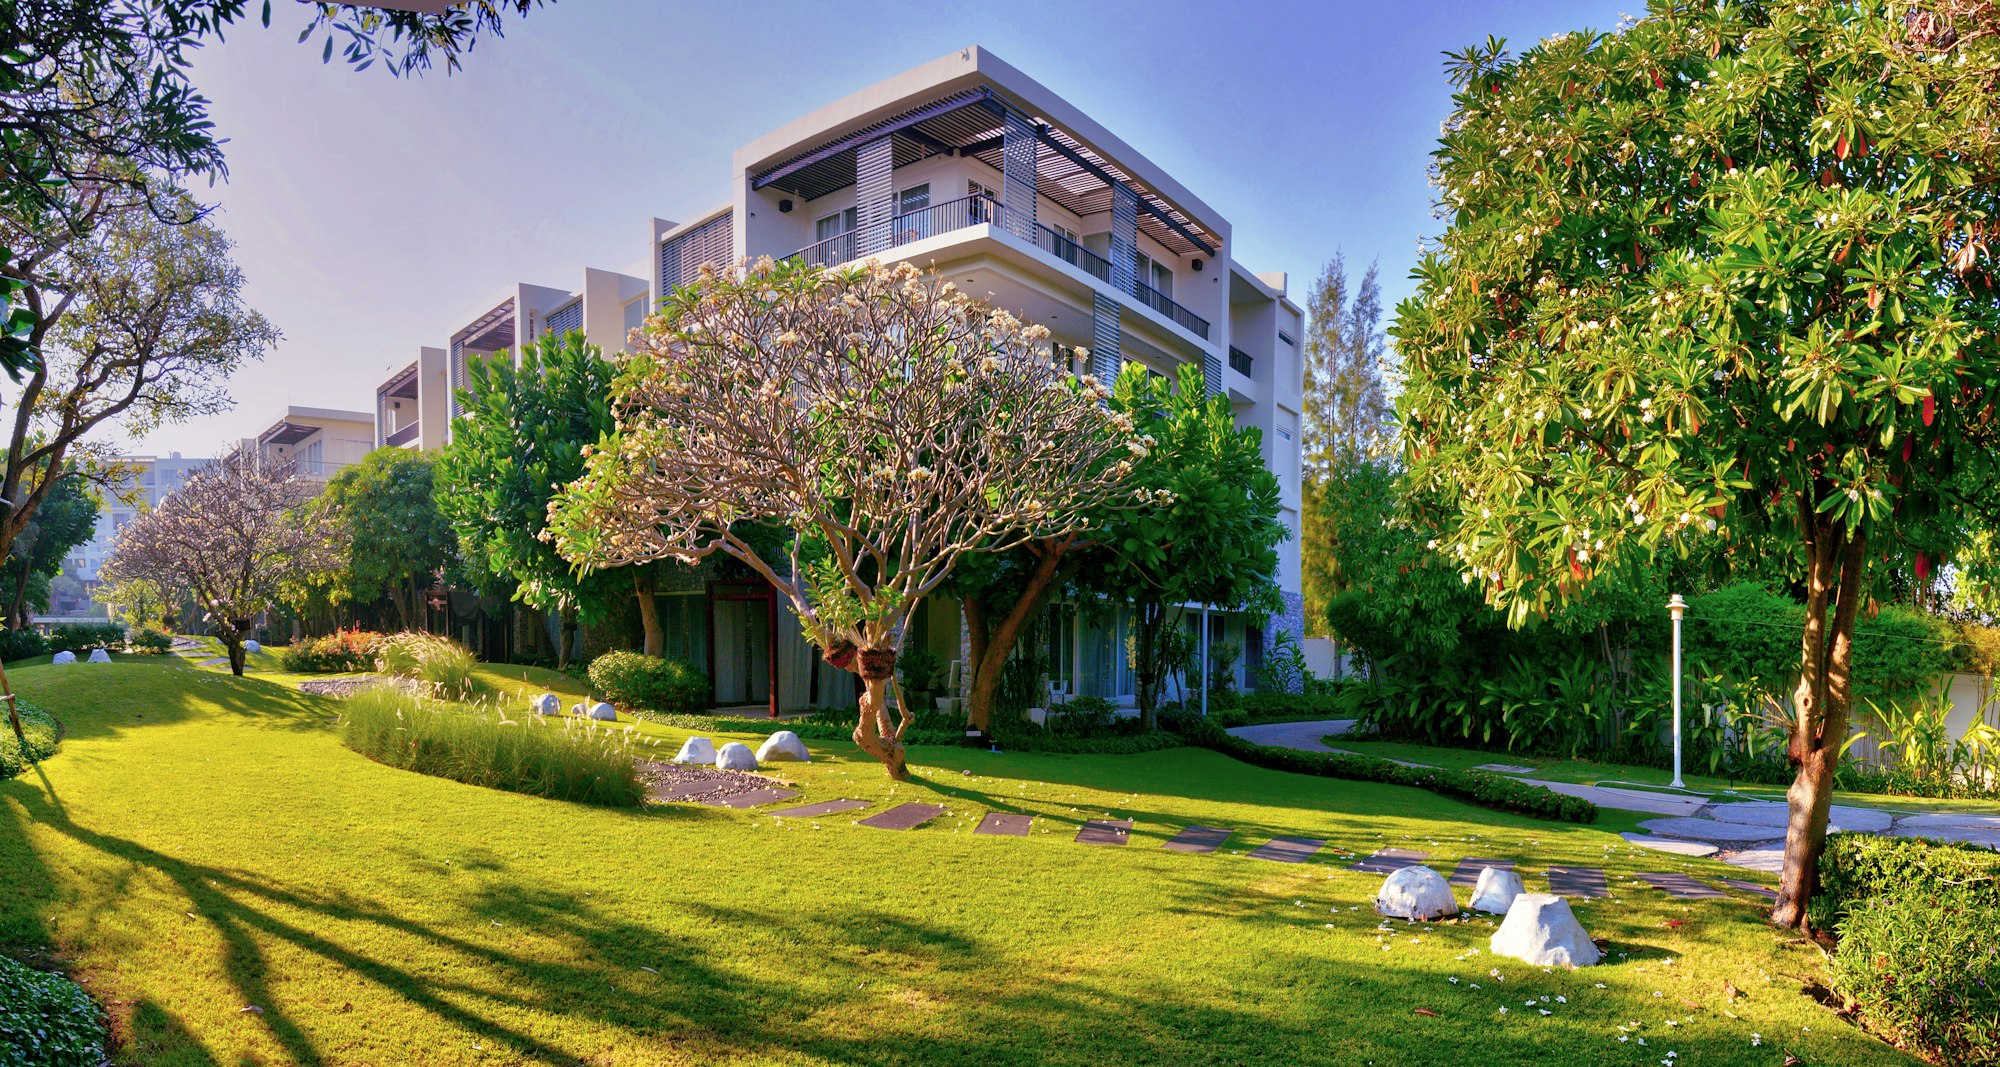
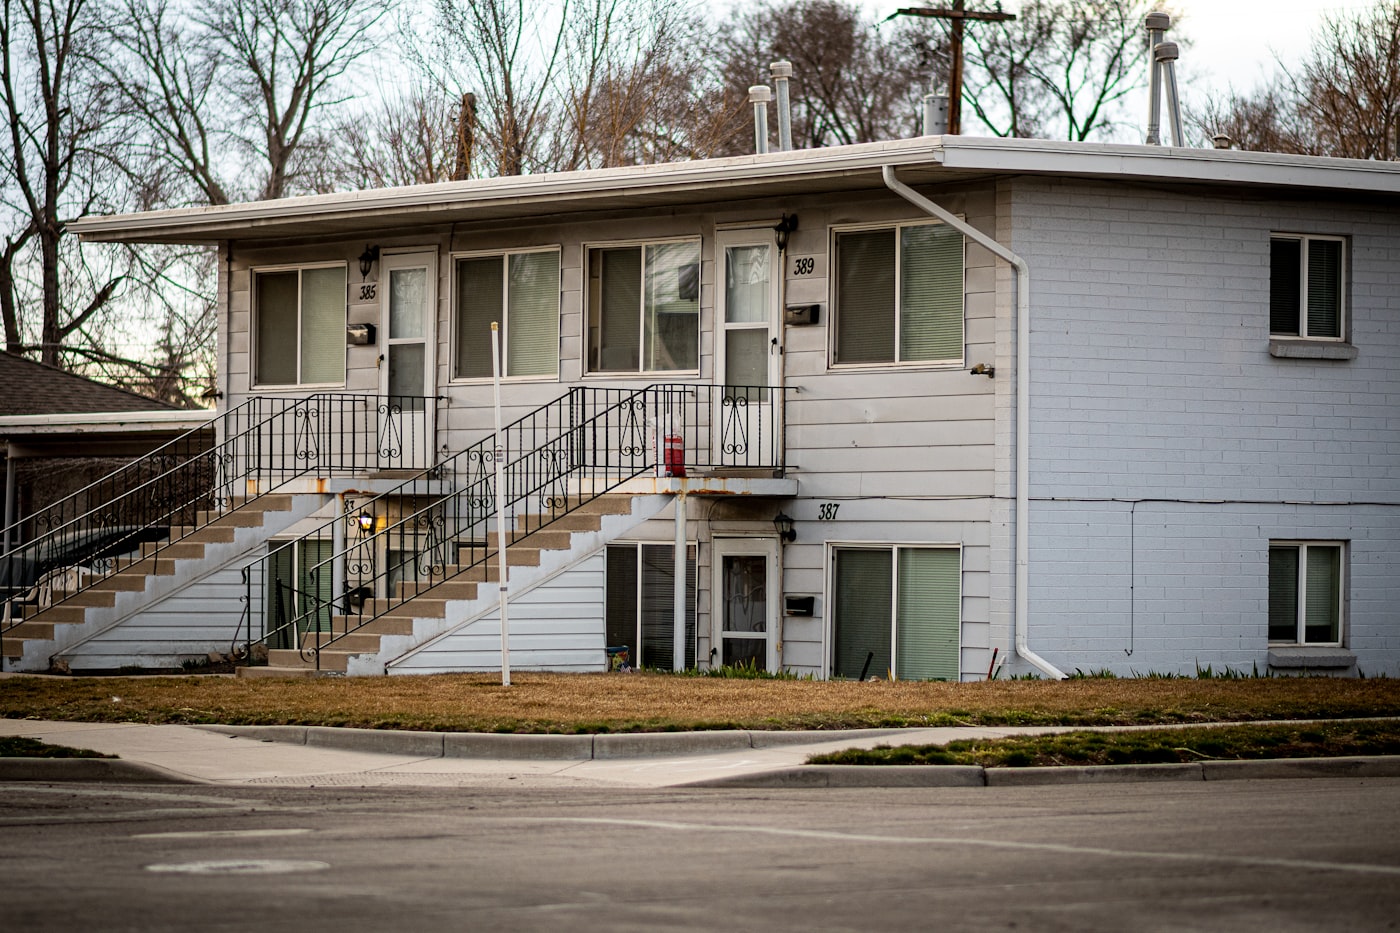
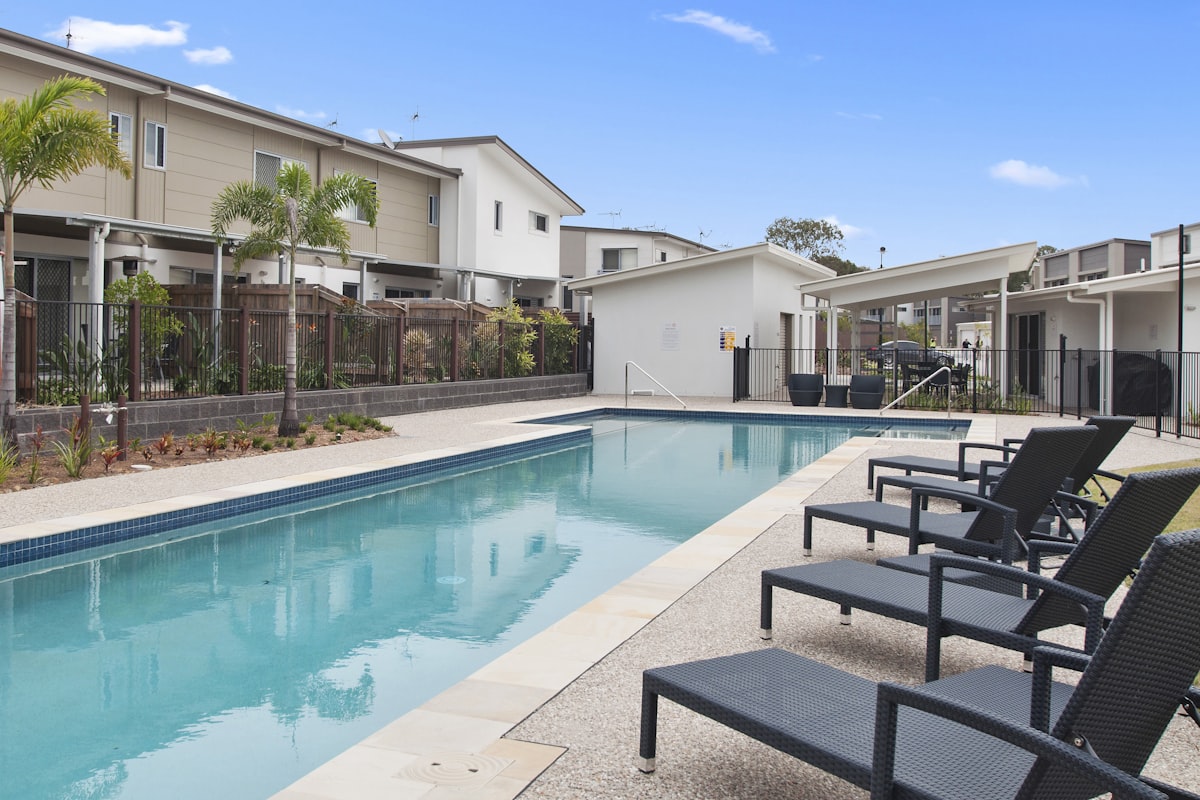
Three two-storey garden buildings around a central pool courtyard, built in 1986 on just under an acre, with subterranean and open parking for 38 vehicles.
Held by the Ridgeway Family Trust since 1998 and professionally managed throughout. Fourteen of twenty-four units have received partial interior updates since 2019; the remaining ten retain original kitchens. All units are individually metered for gas and electricity. The pool was resurfaced and re-plumbed in 2022 and carries a current health-department permit.
Unit Amenities
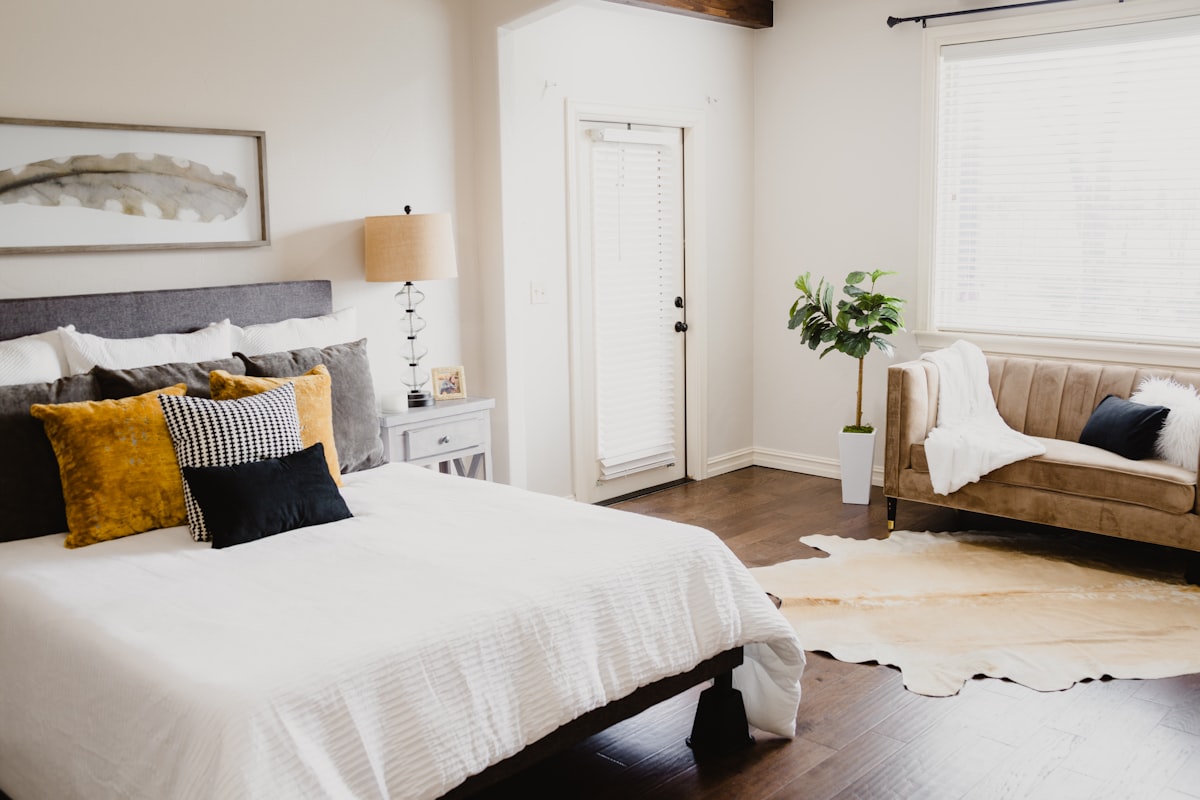
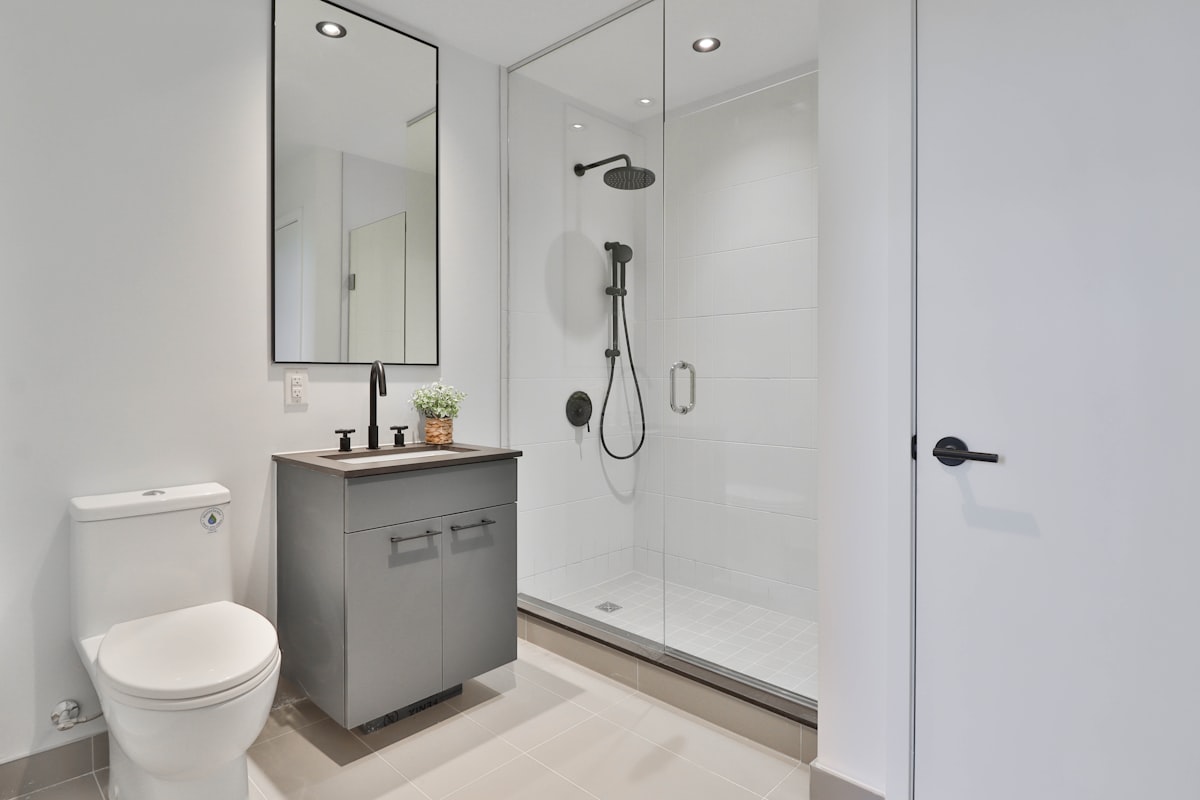
Two full bathrooms in all 2BR and 3BR plans
Updated units: granite counters, laminate flooring, new fixtures
Common Area
Two on-site laundry rooms (leased equipment)
Subterranean parking · Mature landscaped courtyard
Condition Notes for Pricing
| Item | Observed | Pricing Impact |
|---|---|---|
| Roof — three buildings | Replaced 2018, no visible defect | Neutral |
| Ten original-kitchen units | Dated but functional | Supports buyer upside story |
| Subterranean garage | Minor efflorescence, no spalling | Expect an inspection credit request |
| Pool equipment | Re-plumbed 2022, permit current | Neutral |


 S
© OpenStreetMap contributors · © CARTO
Notes
Demographic and vacancy figures are illustrative placeholders for this sample and are not sourced. In a live engagement these come from Census/ACS for the subject ZIP against city and county benchmarks, with submarket vacancy from the client's data provider and the source named here.
| Plan | Count | SF Each | Total SF | In-Place Rent | Rent / SF | Market Rent | Monthly Gap | Annual Gap |
|---|---|---|---|---|---|---|---|---|
| 1BR / 1BA | 8 | 660 | 5,280 | $1,750 | $2.65 | $1,950 | $1,600 | $19,200 |
| 2BR / 2BA | 14 | 920 | 12,880 | $2,150 | $2.34 | $2,395 | $3,430 | $41,160 |
| 3BR / 2BA | 2 | 1,150 | 2,300 | $2,650 | $2.30 | $2,895 | $490 | $5,880 |
| Total / Weighted Avg | 24 | 853 | 20,460 | $2,058 | $2.41 | $2,288 | $5,520 | $66,240 |
What the gap is worth
Capturing the full $66,240 annual gap would lift net operating income to $463,053 and, at the recommended list price, deliver a buyer a 6.22% stabilised return. That is the number a buyer's investment committee will focus on, and it is why this asset supports a going-in cap inside the comparable band despite in-place income that sits below market.
Notes
Presented by plan type rather than unit-by-unit, which is standard at the opinion stage; a unit-level roll is produced for the offering memorandum once a listing is signed. Rent stabilisation limits annual increases on occupied units, so the gap is captured primarily at turnover. Every figure here is invented for this sample.
| # | Address | Units | Yr Built | Sale Date | Sale Price | $ / Unit | $ / SF | Cap | GRM |
|---|---|---|---|---|---|---|---|---|---|
| 1 | 7112 Etiwanda Ave | 22 | 1984 | 02/20/26 | $6,930,000 | $315,000 | $358 | 5.05% | 12.90 |
| 2 | 18420 Sherman Way | 28 | 1979 | 12/11/25 | $8,260,000 | $295,000 | $341 | 5.34% | 12.20 |
| 3 | 7825 Reseda Blvd | 20 | 1988 | 04/28/26 | $6,300,000 | $315,000 | $366 | 5.12% | 12.75 |
| 4 | 18915 Vanowen St | 26 | 1982 | 03/06/26 | $7,930,000 | $305,000 | $352 | 5.22% | 12.45 |
| 5 | 7550 Wilbur Ave | 24 | 1986 | 05/15/26 | $7,560,000 | $315,000 | $362 | 5.09% | 12.85 |
| Comparable Average | 24 | 1984 | — | $7,396,000 | $309,000 | $356 | 5.16% | 12.63 | |
| S | Ridgeway Gardens — recommended | 24 | 1986 | Proposed | $7,450,000 | $310,417 | $364 | 5.21% | 12.57 |


 S
1
2
3
4
5
© OpenStreetMap contributors · © CARTO
Notes
The comparable set was selected on unit count between 20 and 28, construction between 1979 and 1988, and location within two miles of the subject. All five are garden-style walk-ups with surface or subterranean parking. Comparable 2 at $295,000 per unit is the 1979 vintage and the largest of the set, and prices at the bottom of the band accordingly; comparable 5 is the closest match to the subject on both count and vintage and supports the recommendation directly.
| # | Address | Yr Built | Type | SF | Asking Rent | Rent / SF | Amenities |
|---|---|---|---|---|---|---|---|
| 1 | 7240 Amigo Ave | 1985 | 2BR / 2BA | 900 | $2,350 | $2.61 | Pool, gated |
| 2 | 18110 Saticoy St | 1988 | 2BR / 2BA | 940 | $2,425 | $2.58 | Pool, in-unit W/D |
| 3 | 7615 Lindley Ave | 1981 | 2BR / 2BA | 880 | $2,295 | $2.61 | Gated only |
| 4 | 18740 Kittridge St | 1990 | 2BR / 2BA | 950 | $2,450 | $2.58 | Pool, fitness |
| 5 | 7020 Balboa Blvd | 1984 | 2BR / 2BA | 910 | $2,375 | $2.61 | Pool, gated |
| Comparable Average | 1986 | 2BR / 2BA | 916 | $2,379 | $2.60 | — | |
| S | Ridgeway Gardens — in place | 1986 | 2BR / 2BA | 920 | $2,150 | $2.34 | Pool, gated |
| S | Ridgeway Gardens — market | 1986 | 2BR / 2BA | 920 | $2,395 | $2.60 | Pool, gated |
Notes
The market rent of $2,395 is set at $2.60 per square foot — exactly the comparable average — rather than at the top of the range. Comparables 2 and 4 achieve more on the strength of in-unit laundry and a fitness room, neither of which the subject offers. This is a deliberately conservative market rent: a buyer who discounts an aggressive pro forma will discount the price, and the objective is a market rent the buyer's own survey will confirm. Every figure here is invented for this sample.
A structured process with a fixed offer date. The objective is to create a single moment of competition rather than a sequence of one-off negotiations.
Preparation
- Professional photography and drone
- Offering memorandum produced
- Financial package assembled and reconciled to the trailing twelve
- Title ordered and reviewed for disclosure items
- Tenant notification plan agreed with ownership
Active Marketing
- Launch to our buyer database and the major listing platforms
- Direct outreach to 1031 exchange buyers in escrow
- Broker-community distribution across the Valley
- Scheduled property tours, twice weekly
- Weekly written activity report to ownership
Call for Offers
- Fixed offer deadline announced at launch
- Offers summarised side by side on price, terms, and buyer credibility
- Best and final round with shortlisted buyers
- Ownership selects; letter of intent executed
Contract & Close
- Purchase agreement negotiated and signed
- 21-day due diligence with deposit released at expiration
- Appraisal and lender coordination
- 30-day close following due diligence
- Estoppels, rent roll certification, and transfer of deposits
What we need from ownership
Proposed Terms
- Listing term
- Six months
- Commission — total
- 4.0% of sale price
- Cooperating broker share
- 2.0%
- Marketing costs
- Borne by Weston Ridge
- Photography & OM production
- Included
- Cancellation
- 30 days' written notice, no fee
On the offer deadline
A fixed offer date is the single most effective mechanism available to a seller in this size band. It converts a sequence of individual negotiations, in which each buyer knows only their own position, into one round in which every buyer must assume they are competing. In our experience it is worth more than any amount of individual negotiation after the fact — and it is only credible if the launch price sits inside the range buyers can verify, which is the argument made on page 5.
Track record figures
Every statistic on this page is invented for this sample. In a live engagement these are the client's own verified numbers, and any performance claim would be supportable from closed transaction records on request.
opportunity.
Principal, Multifamily Investments
CA DRE #01999901
(818) 555-0140
dana.whitfield@westonridge.example
Director, Investment Sales
CA DRE #01999902
(818) 555-0141
andre.cortez@westonridge.example
Photography via Unsplash — allPhoto Bangkok, Nathan Bang, Steven Ungermann, Isaac Martin, Lotus Design N Print.