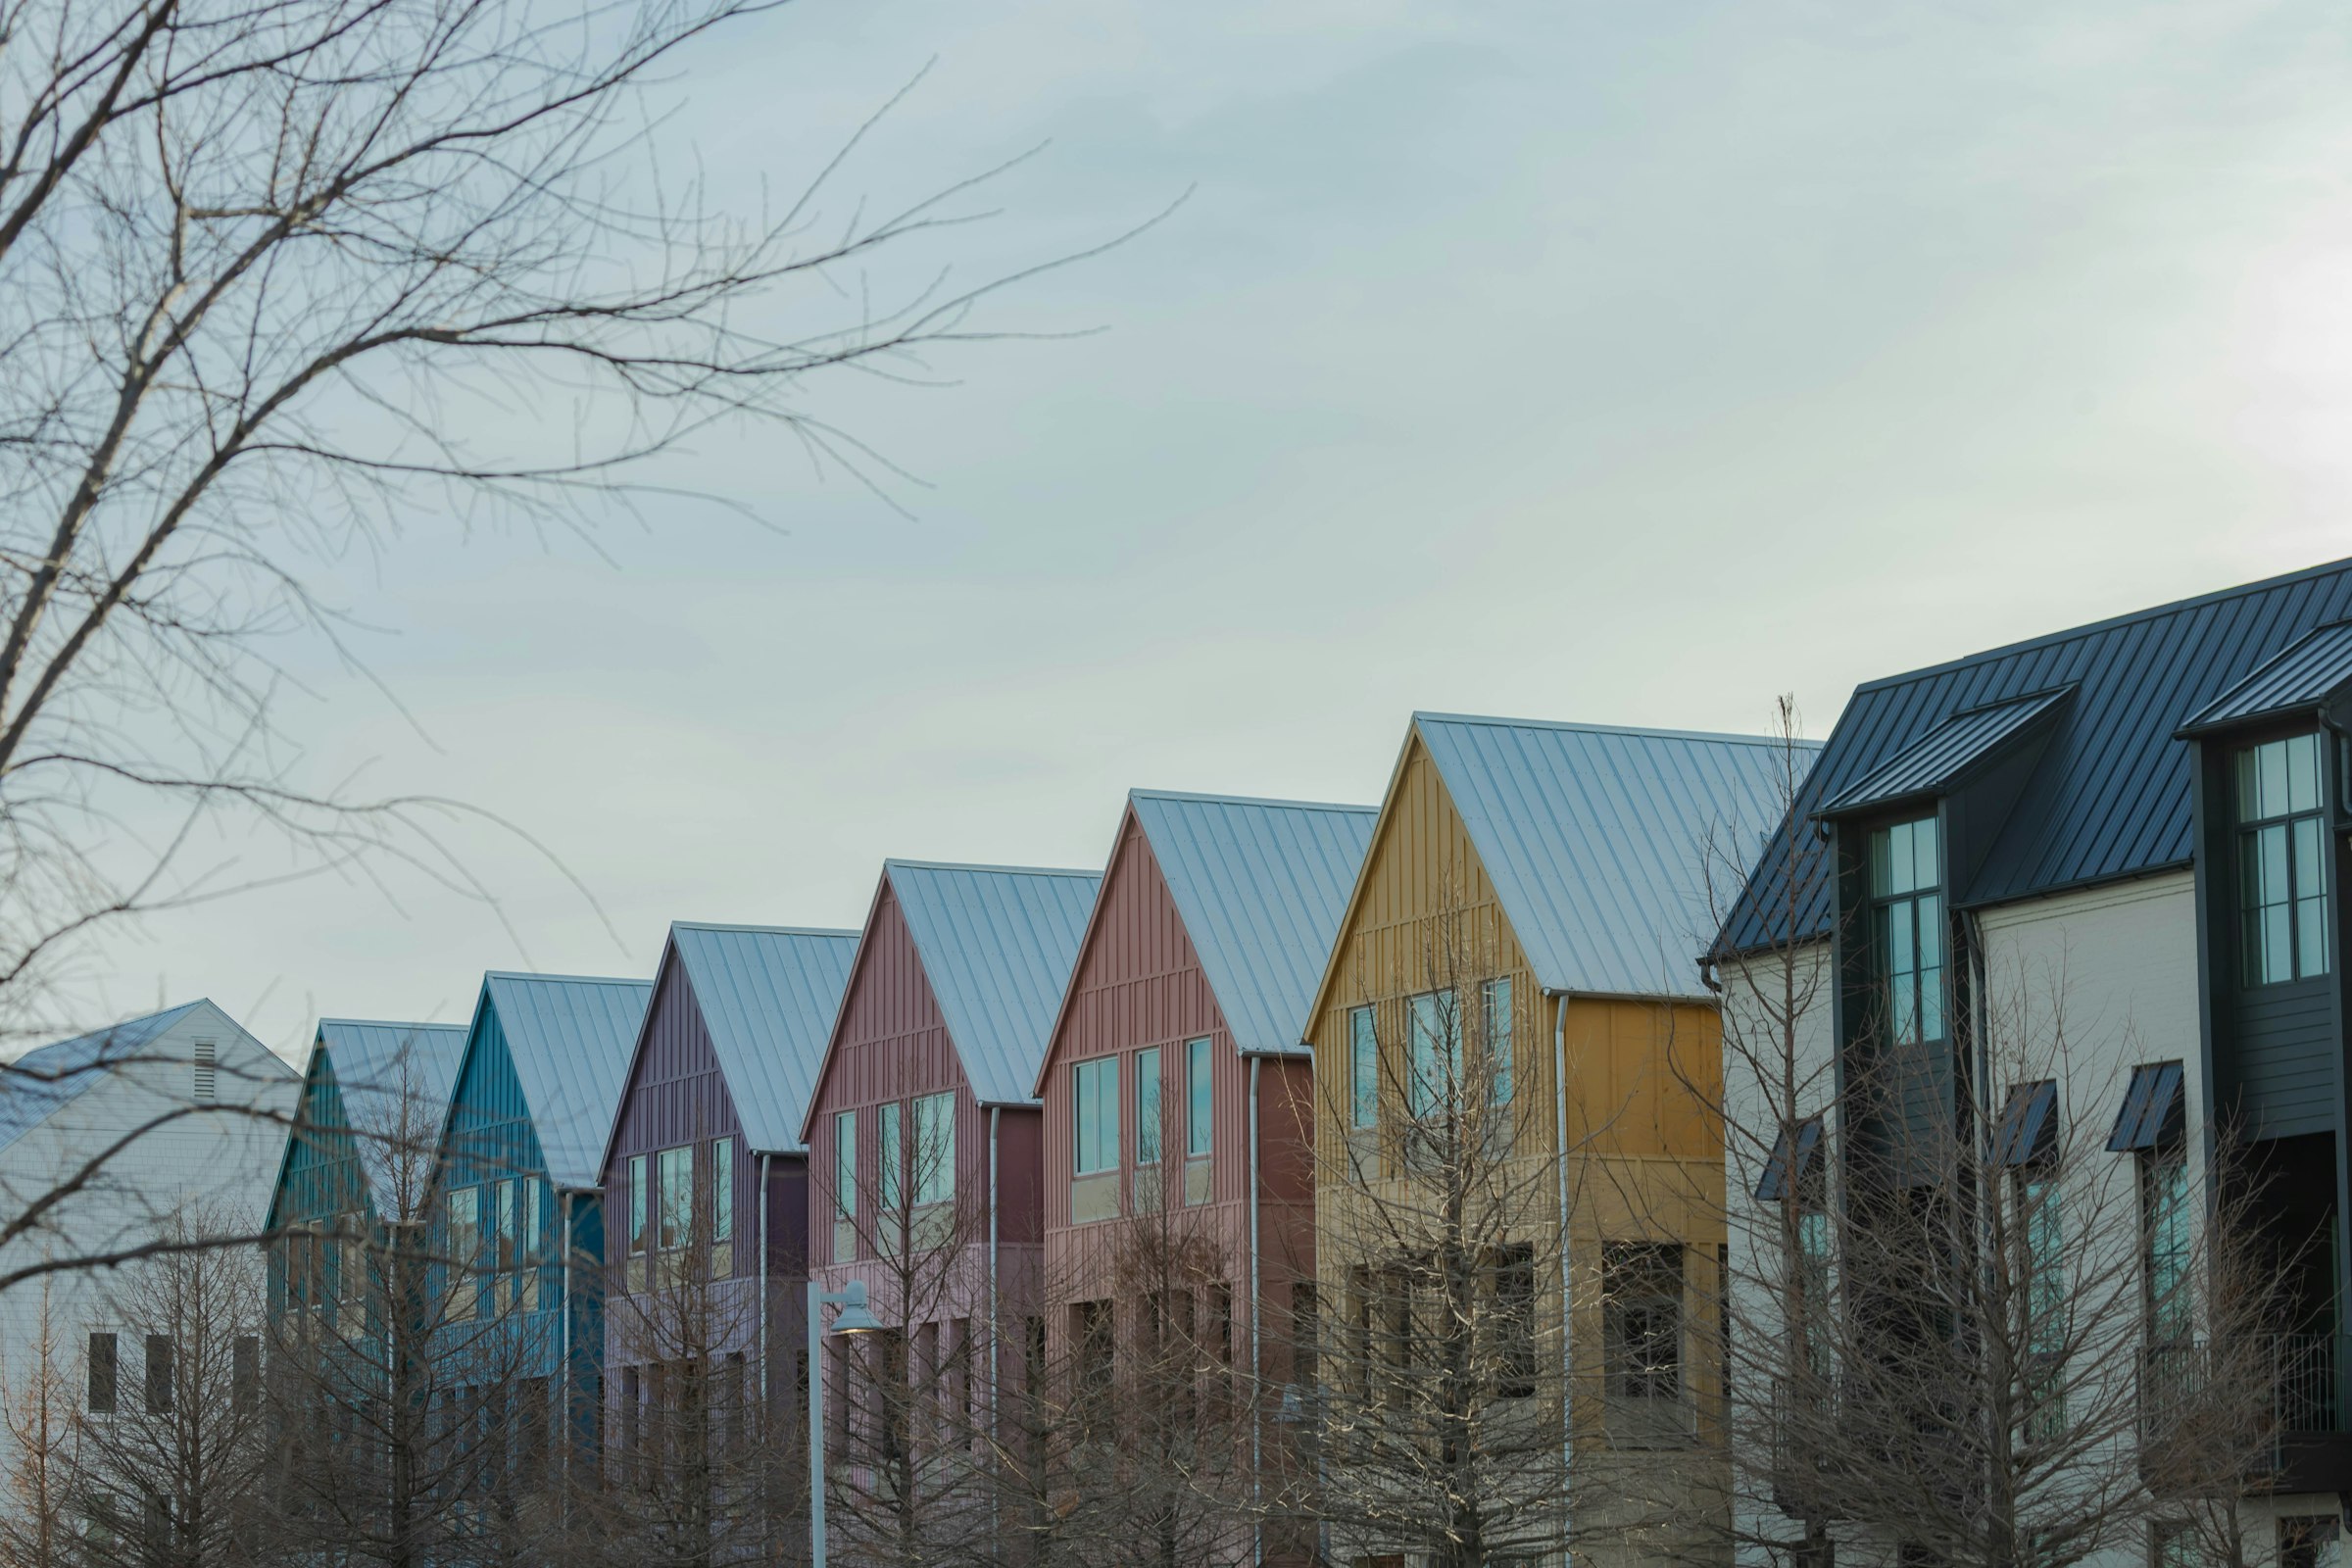
North Hollywood
Site Particulars
- Address
- 5100 Palmwood Avenue
- Land area
- 22,000 SF (0.51 ac)
- Approved units
- 14 attached townhomes
- Density achieved
- 1,571 SF of land per unit
- Total sellable area
- 23,080 SF
- Average unit size
- 1,649 SF
- Parking approved
- 28 spaces, 2 per unit
- Height / stories
- 3 stories, 45 ft
- Current improvements
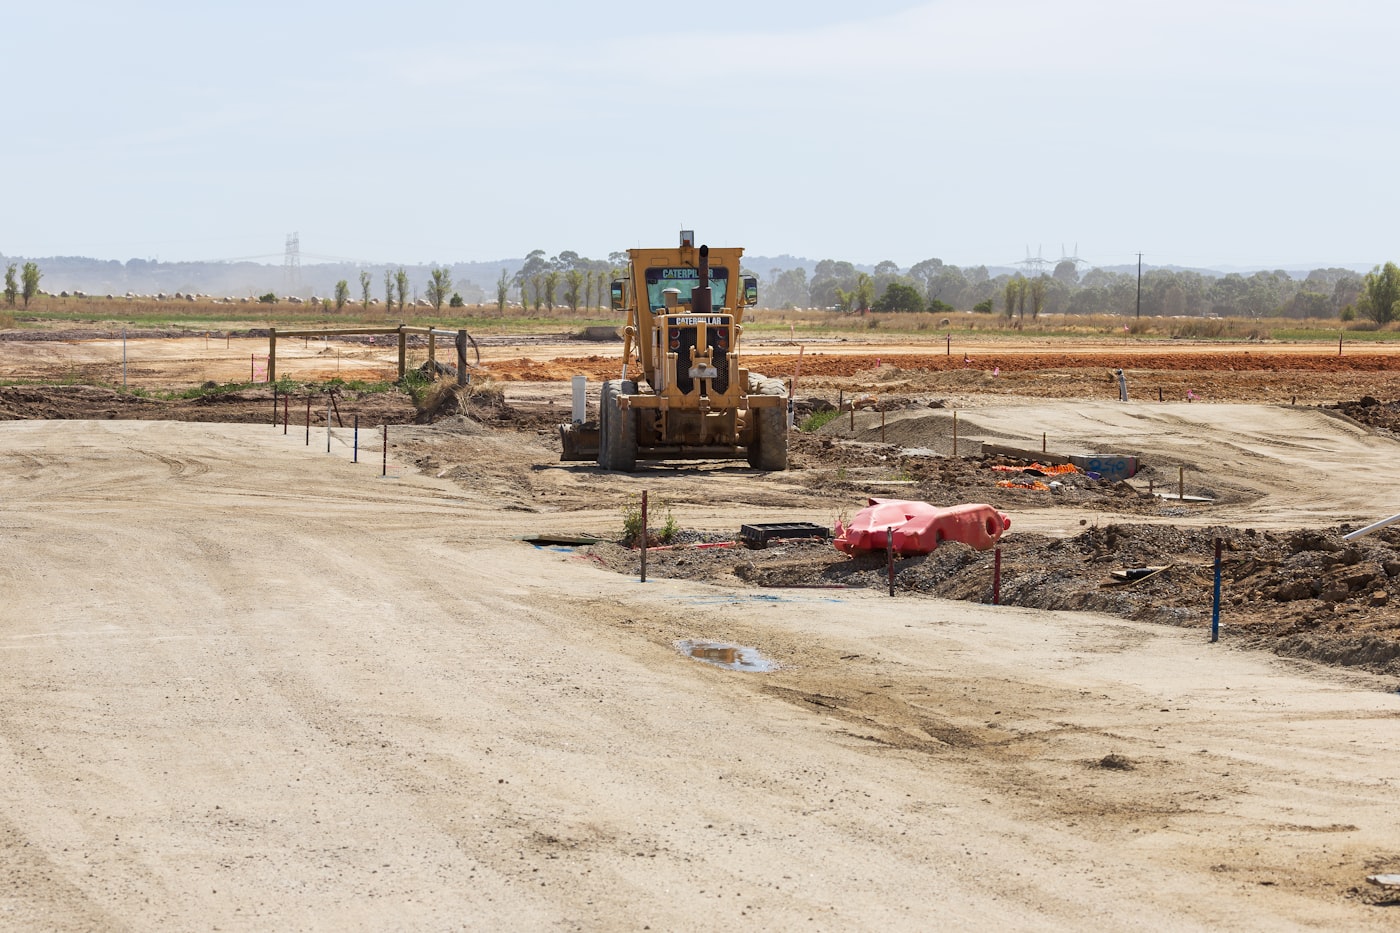
- Vacant, graded, fenced
Entitlement Milestones Completed
| Vesting tentative tract map | Approved |
| Site plan review | Approved |
| Environmental clearance | Adopted |
| Appeal period | Expired |
| Haul route | Buyer scope |
| Building permit | Buyer scope |
What the buyer still carries
Construction drawings, plan check, building permit, school fees, and utility connections remain buyer scope and are carried in the soft-cost line at 18% of hard cost. The tract map has three years remaining before extension is required. A haul route approval will be needed prior to grading.
| Plan | Count | Beds / Baths | SF Each | Total SF | Price Each | $ / SF | Plan Sellout |
|---|---|---|---|---|---|---|---|
| Plan A | 6 | 3 BR / 2.5 BA | 1,520 | 9,120 | $895,000 | $589 | $5,370,000 |
| Plan B | 6 | 3 BR / 3 BA | 1,700 | 10,200 | $965,000 | $568 | $5,790,000 |
| Plan C | 2 | 4 BR / 3.5 BA | 1,880 | 3,760 | $1,095,000 | $582 | $2,190,000 |
| Total / Weighted Avg | 14 | — | 1,649 | 23,080 | $953,571 | $578 | $13,350,000 |
Pricing logic
Plan A carries the highest per-foot price and the lowest absolute price — the standard relationship in attached product, where the smallest plan reaches the deepest buyer pool and clears first. Plan C is priced at a discount per foot to its size because four-bedroom attached product in this submarket has a materially thinner buyer pool, and the two units are positioned to close last.
| # | Address | Land SF | Units | Price | $ / Unit | $ / SF |
|---|---|---|---|---|---|---|
| 1 | 6120 Vineland Ave | 18,500 | 12 | $2,280,000 | $190,000 | $123 |
| 2 | 5840 Cahuenga Blvd | 24,000 | 16 | $3,120,000 | $195,000 | $130 |
| 3 | 11820 Sherman Way | 20,000 | 12 | $2,340,000 | $195,000 | $117 |
| 4 | 5330 Klump Ave | 26,500 | 18 | $3,420,000 | $190,000 | $129 |
| Comparable Average | 22,250 | 15 | $2,790,000 | $192,500 | $125 | |
| S | Alder Row — offered | 22,000 | 14 | $2,750,000 | $196,429 | $125 |
Notes
All four comparables were entitled at the time of sale, which is the correct basis for comparison — unentitled land in this submarket trades 30–40% below these figures and carries the approval risk this site has already cleared. The subject prices 2.0% above the average per unit and exactly at the average per land foot, reflecting a slightly larger average unit size than the comparable set.


 S
1
2
3
4
© OpenStreetMap contributors · © CARTO